How to customize curves/plots and report in BTSDA
You can customize the curves/plots you want in our BTSDA software. I’ ll give an example of the method about getting Time- current & voltage curve for you. You can get other kind of curves/plots by the same way.
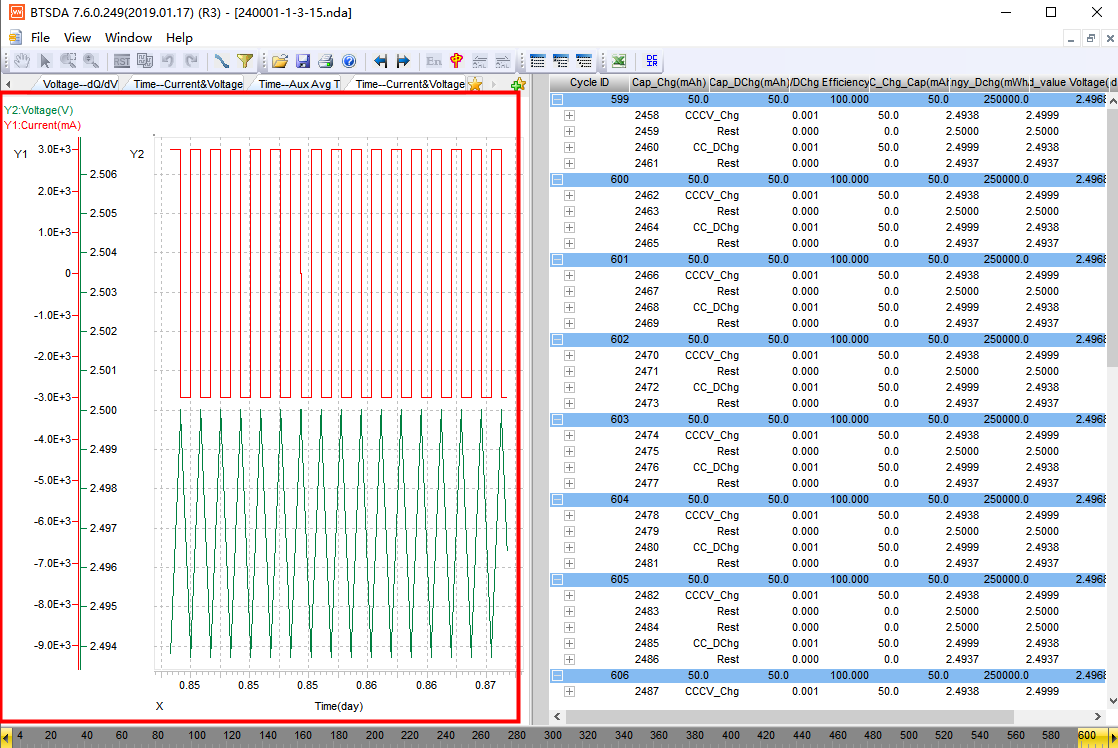
Following screenshot is a typical NDA(Neware data analyzer) file opened in our software BTSDA.
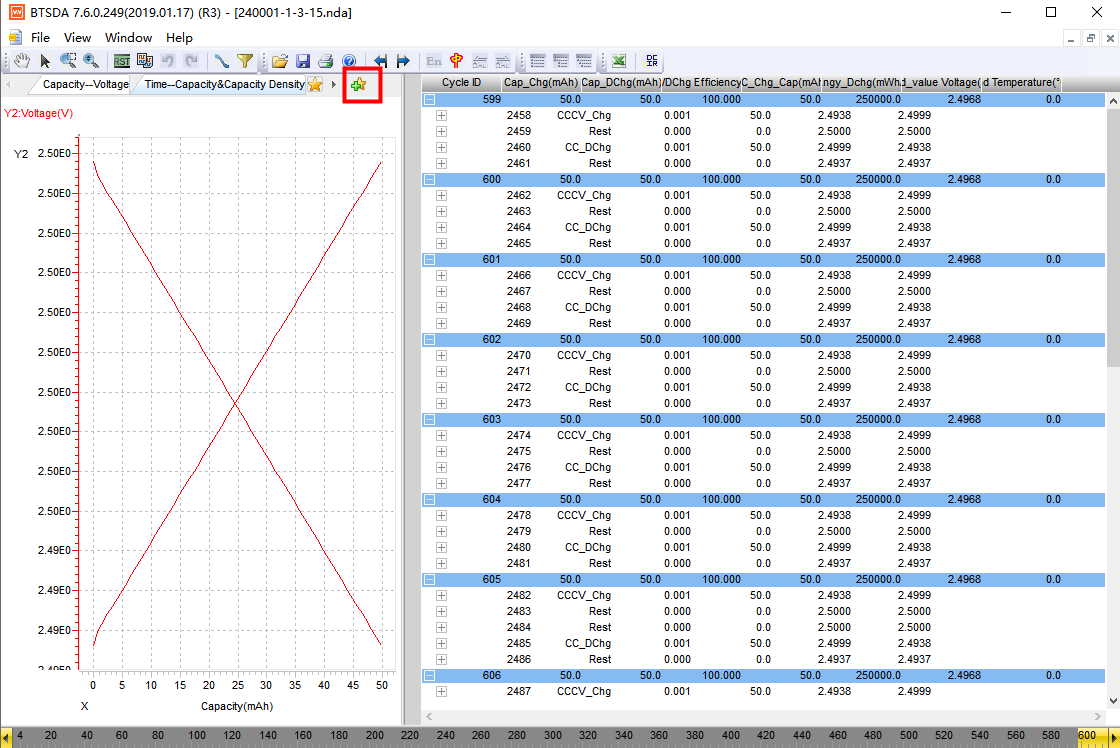
And let’s use following steps to create/customize a typical time VS. voltage and current plot.
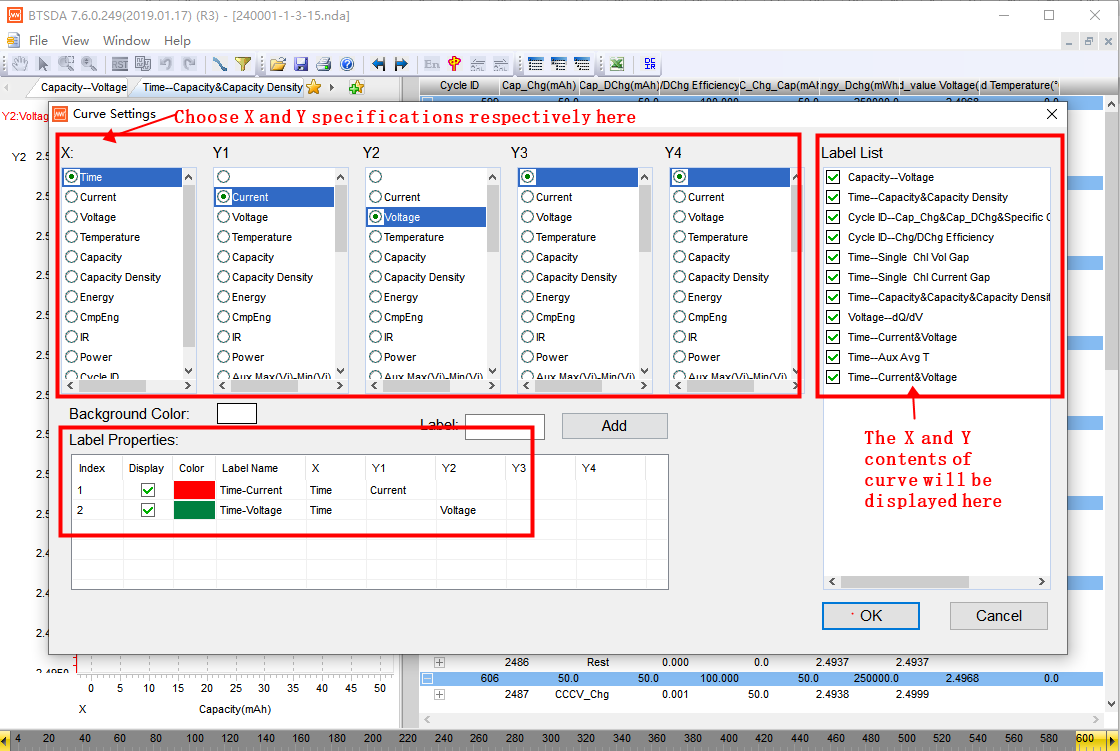
1. Click ![]() to select the X = “time”, and Y1= current, Y2= voltage, and click “OK”.
to select the X = “time”, and Y1= current, Y2= voltage, and click “OK”.
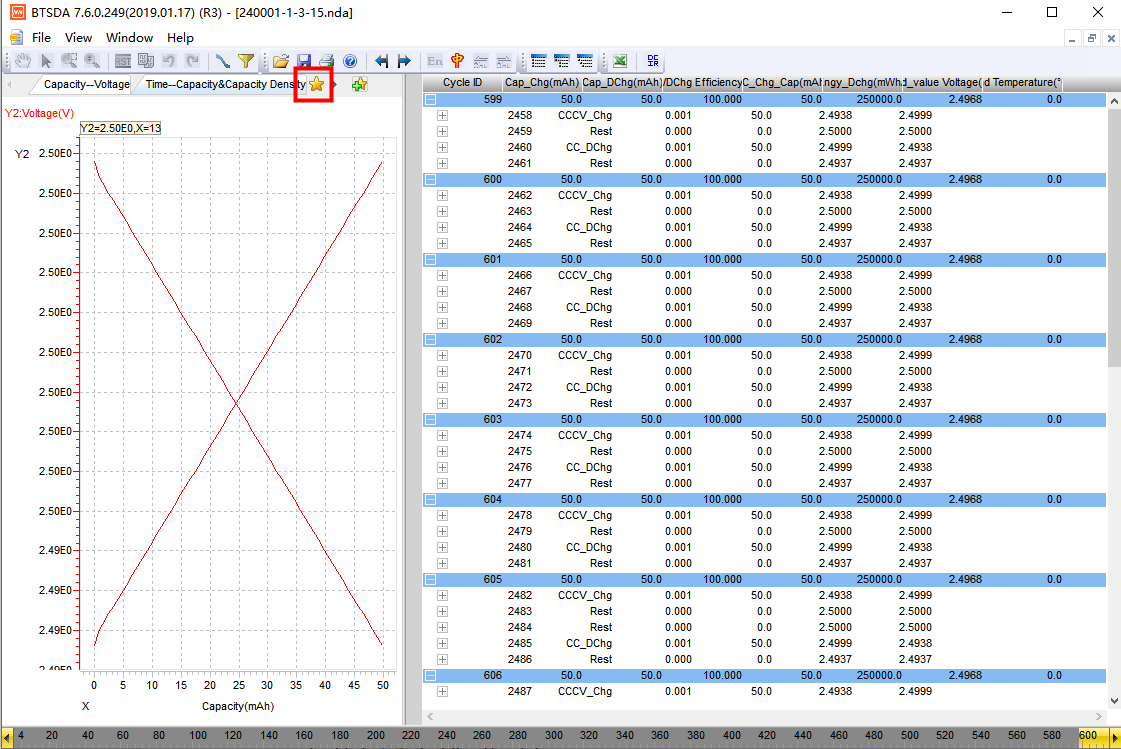
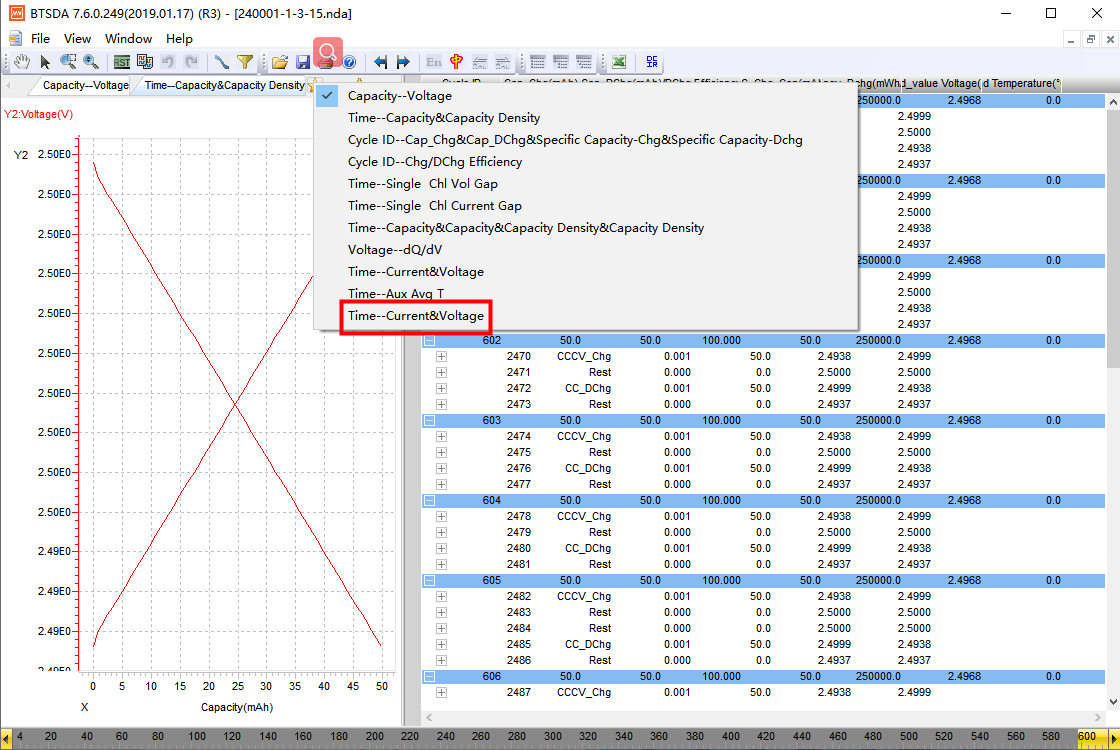
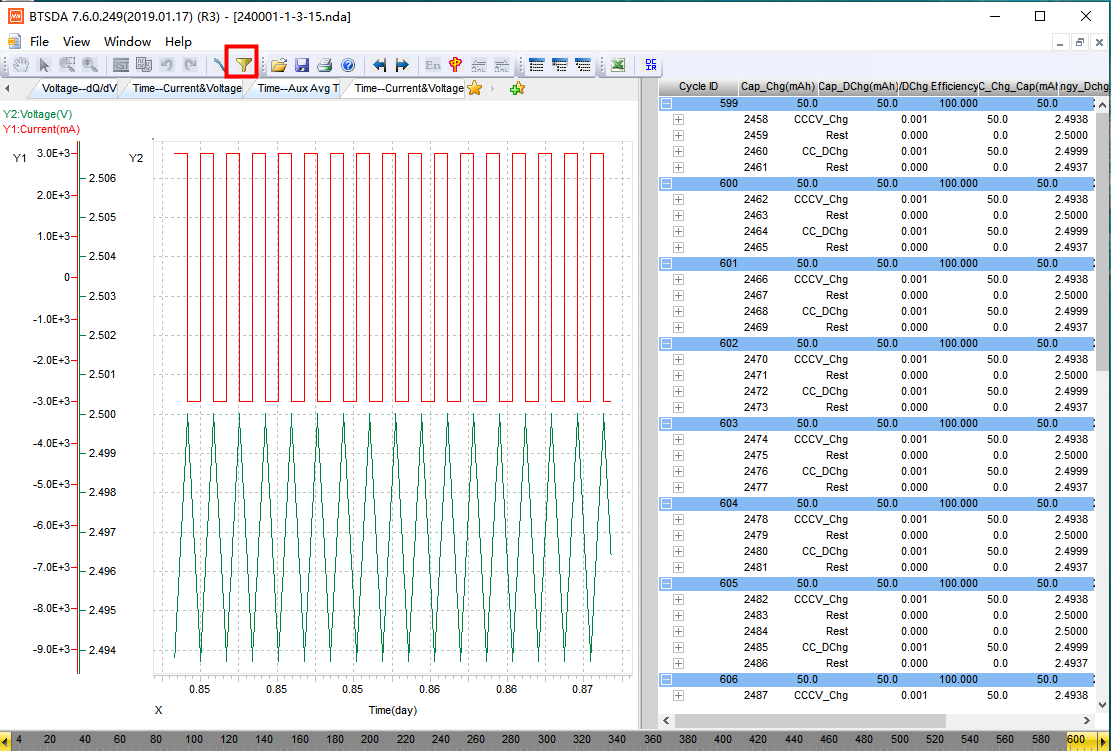
2. Click ![]() ,select Time- current & voltage curve. Then you can get it successfully.
,select Time- current & voltage curve. Then you can get it successfully.
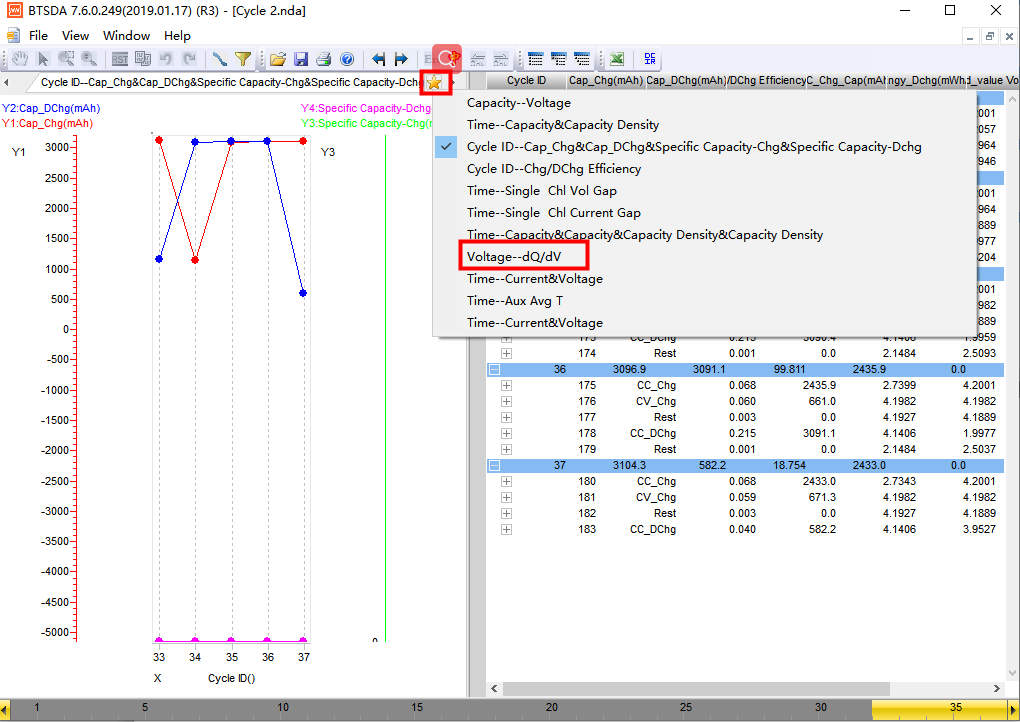
3. However, when you are customizing Voltage --dQ/dV curves, after finishing above steps. If the initial curve is not what you want, or some data points deviate too much with others, you can filter the data and redraw the curve again.
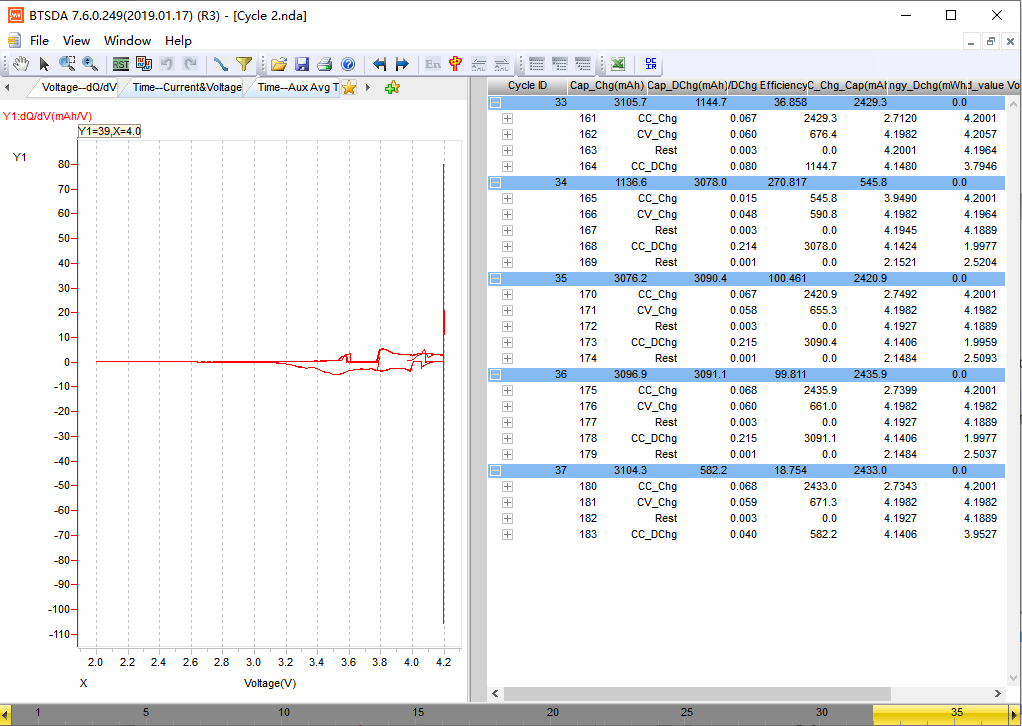
(Initial Voltage- dQ/ dV curves)
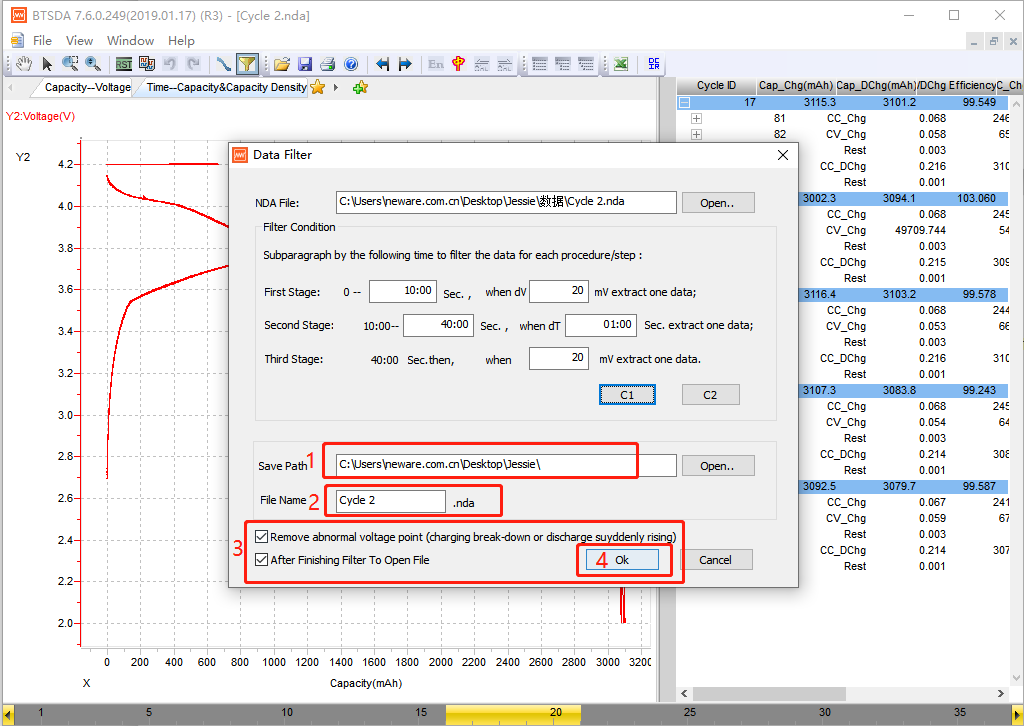
4. Click ![]() to filter the data.
to filter the data.
5. For time interval and dV/ dT setting, you can click “C1”or “C2”, time interval and dV/ dT will be set automatically. Of course the C1/C2 setting needs to accord with your requirements. If not, you can enter the parameters by yourself.
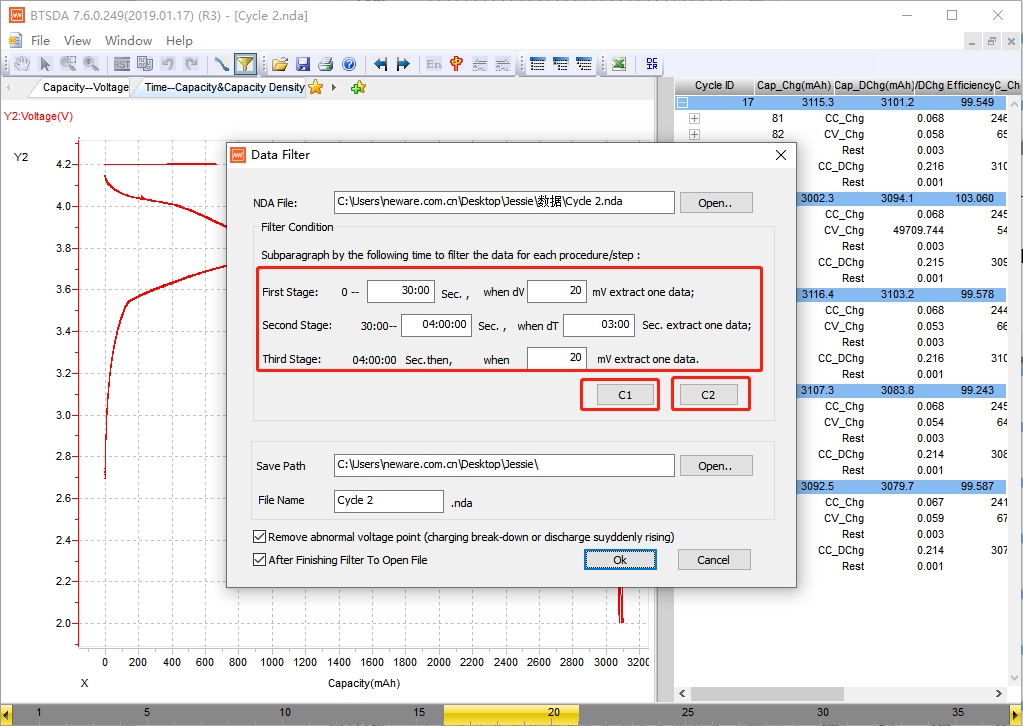
6. Select save path and enter file name. Meanwhile, choose “Remove abnormal voltage point” and “After finishing filter to open file”, then click “OK”.
7. Click ![]() and choose voltage-- dQ/dV . And you can get the curve again.
and choose voltage-- dQ/dV . And you can get the curve again.
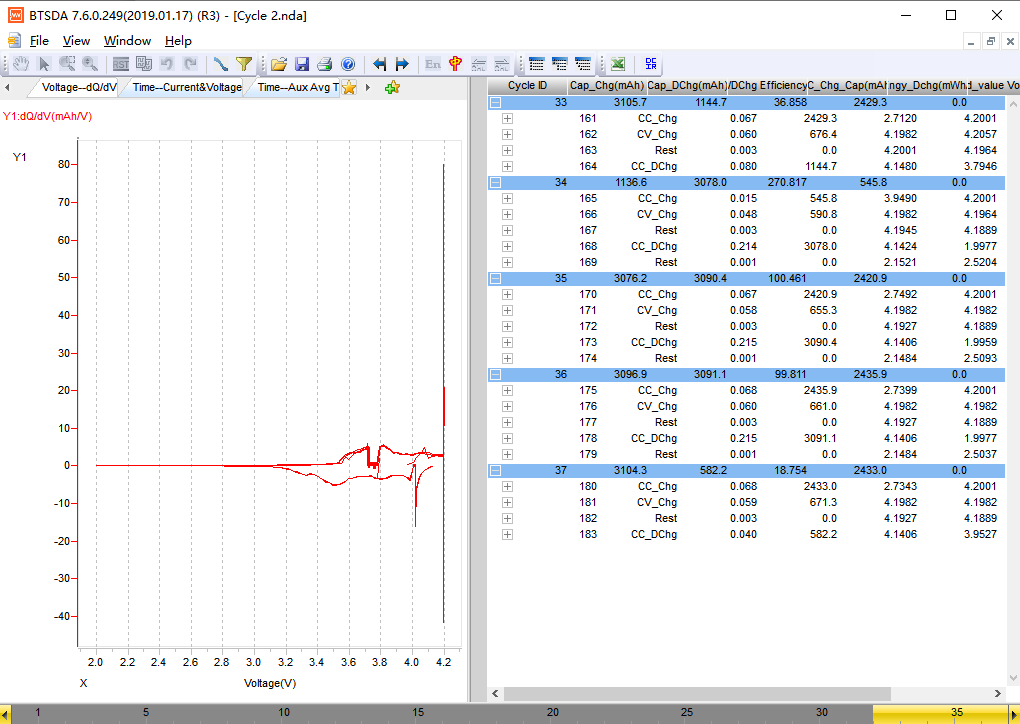
(Finally Voltage- dQ/dV curve)
For more details, please feel free to contact me at jessie@newarebattery.com
Leave A Comment